Lab 3: Querying the attribute table
In this lab we learn how to make queries in the attribute table, calculate
new fields, and show the results on maps.
1. Calculating a new field: Available water capacity
I would like to find out more about what the various soil properties mean.
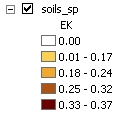
First I tried looking at EK, which stands for Erosion Factor K, according
to the Metadata
table. This factor describes the susceptibility of soil to erosion
by rainfall, and is used in the Revised
Universal Soil Loss Equation, developed by the US Department of Agriculture.
Unfortunately, several patches show K as 0, but I don't believe this is
true. I suspect it's missing data, so I set the color for that value to
none.
Since there was missing data, let's try something else. Instead, I'll
look at the fields WATER_HI and WATER_LO, which refer to "available water
capacity." After a little web searching, I found an
explanation
from University of Nebraska-Lincoln: available water capacity is the
amount of water that can be stored in the soil and taken up by plants (it's
less than the total water in the soil, because water adheres to the small
particles in soil, and there's a limit to how much suction a plant's roots
can exert). Obviously, this is important here in the Bay Area, where there
is no rainfall during the summer and plants must subsist on water stored
in the soil. Probably there are high and low values recorded because soil
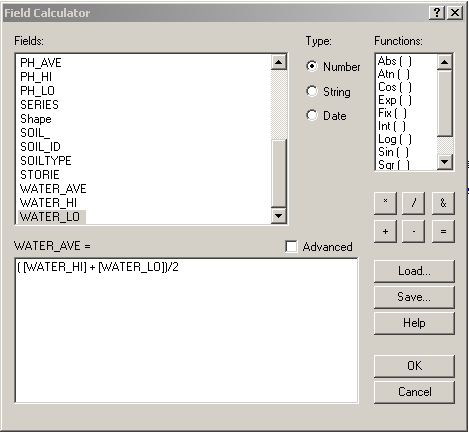
isn't perfectly uniform across a polygon. But to make a simple map, and
demonstrate how to calculate with field values, I'll define an average
water capacity:
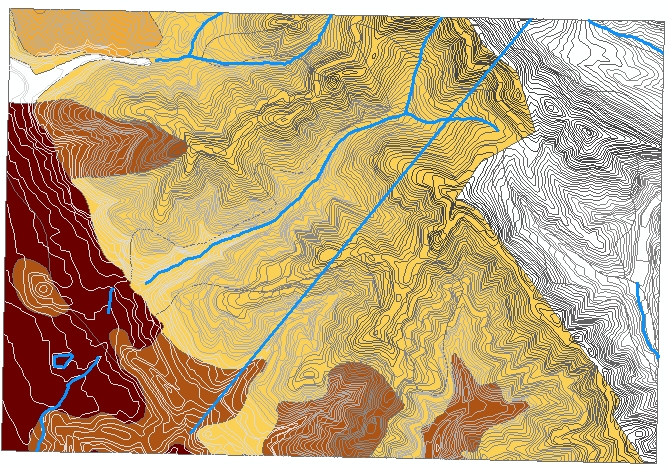
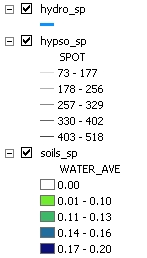
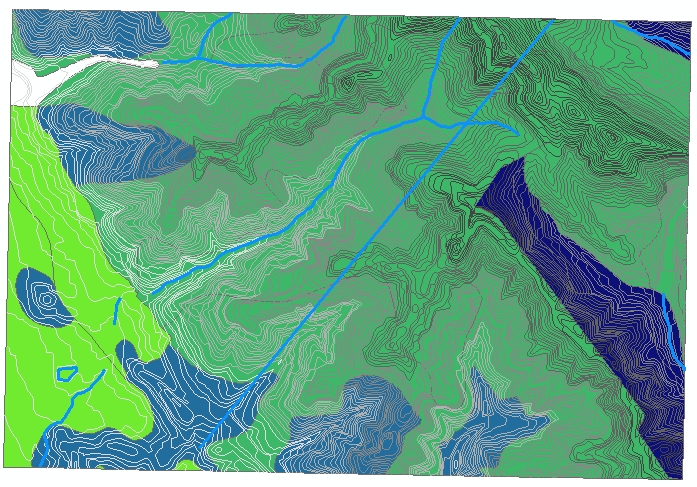
To display the water capacity on a map, I chose a green to blue color
map, since blue suggests water. Also, one patch has a water capacity of
zero, but I think this is because it contains the football stadium and
swimming pool, so water capacity doesn't really apply; therefore, I set
its color to none. The contour lines and water courses are added to help
the reader recognize the features in the region. Claremont Creek is the
stream running down the canyon in the middle, and the straight blue line
is the tunnel which brings our drinking water into Oakland and Berkeley,
and is currently being
seismically
upgraded to withstand the next earthquake.
2. Selecting by attribute
The water capacity in the highest range is up to twice as much as in the
lower ranges. Are there some kinds of plants that require the higher water
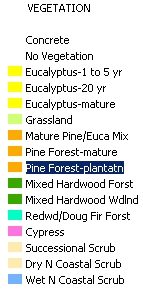
capacity soils and can't grow on the lower ones? To find out, I added the
vegetation layer and color-coded it with unique values of the "vegetation"
field. The map was too hard to read since there are so many different types
of vegetation, so I changed the colors to lump some of the categories together,
and selected colors that are sort of suggestive: dark green for hardwood
forest, yellow and orange for eucalyptus and pine since they are fire risks,
etc. The contour lines and streams are also included because it's interesting
to see how the vegetation changes when you cross a ridge line.
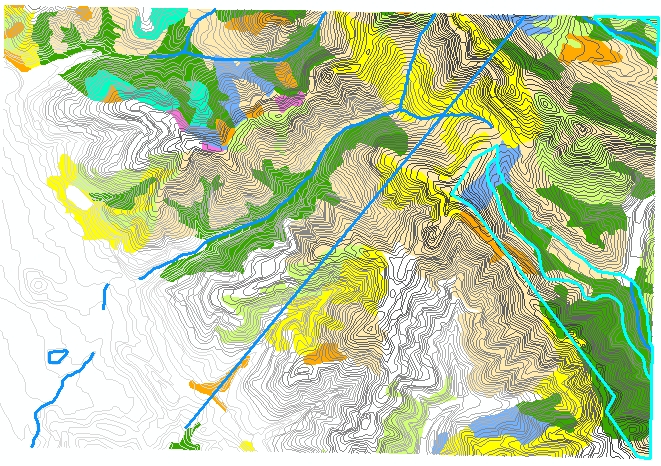
On top of this, I selected the highest water capacity soils from the
soils layer, as shown by the thick blue lines.
The high water capacity soils, on the east slope and the upper right
corner, contain some hardwood forest and wet scrub, which require more
water than dry scrub and grassland. But hardwood forests are also found
other places, such as along Claremont Creek and on the south slope of Strawberry
Canyon, where the soil has less water capacity. So they aren't dependent
on that particular soil series.
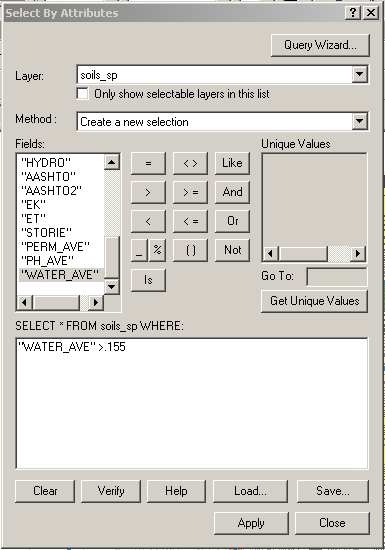
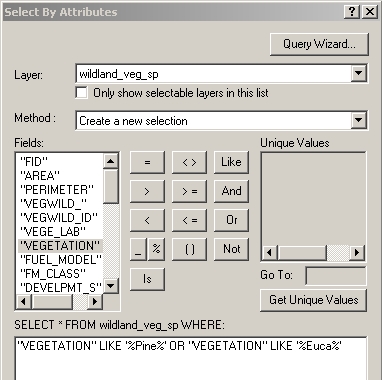
3. Combination queries
Queries can also be combined with AND and OR operators, and strings can
be searched with wildcards. For example, let's look for flammable non-native
vegetation. (See the comprehensive natural history of the region by the
Claremont
Canyon Conservancy. Pine trees and eucalyptus were introduced by humans
in the early 20th century, and turned out to be highly flammable.) Select
all patches where the vegetation field contains either the string "Pine"
or "Euca", using wildcard matching:
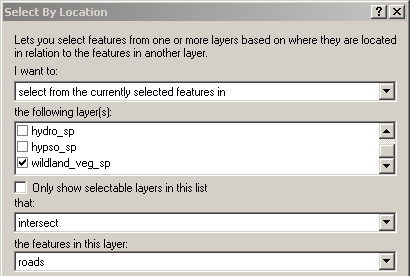
However, the Conservancy also points out that these trees don't catch
fire on their own: "Ignition without the presence of humans is unlikely
since lightning strikes during dry weather are practically nonexistent."
Ignition comes from human sources, such as cigarettes, fireworks, or hot
exhausts of cars parked over dry roadside vegetation. Therefore, I'd like
to select just the eucalyptus and pine patches that intersect roads, using
the Select By Location dialog from the Selection Menu:
I added the roads to the map. Also, to make the selected regions stand
out more, I used the Selection tab of the Properties dialog for the layer
to add some cross-hatching to the selections.
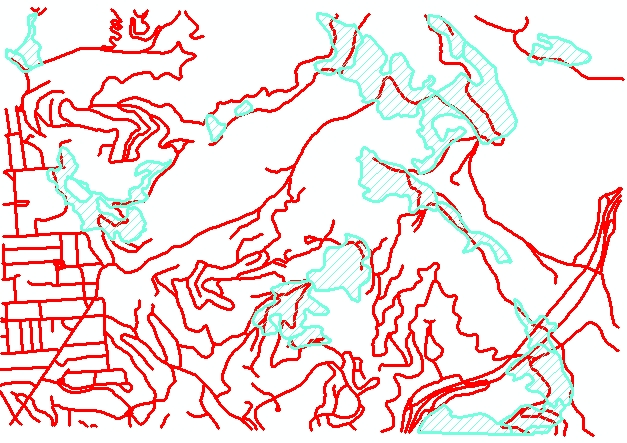
These patches should get special attention for fire prevention, such
as cutting
down the eucalyptus.
Return
to my main page.