In the newsgroup alt.fan.cecil-adams on Usenet, there was a discussion of the number of persons needed in a room to get a greater than 50% chance of having two persons with the same birthday or having every birthday represented. Perry Farmer questioned the reasonableness of the assumption of uniformity of the distribution of birthdays in a calendar year. I opined that the distribution was reasonably close to uniform. Having access to a large number of birthdates from life insurance policy applications, I volunteered to analyze the available data.
I retrieved birthdates from 480,040 insurance policy applications made between 1981 through 1994 of a Life Insurance Company. (The data summarized by birthdate can be found here) I summarized the data by date, by month and by day of month.
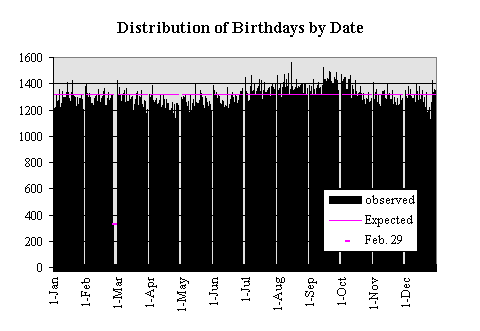
If we hypothesize that the distribution of birthdays is uniform, then the probability of a birthdate (other than Feb. 29) is 1/365.25 and the probability of a Feb 29th birthdate is 1/1461. We can conclude that the number of people with a given birthday is a binomial distribution with mean=n*p=1314.28 (328.57 for Feb. 29) and variance=n*p*q=1313.41 (329.03 for Feb 29). This is a graph of the actual observations with the expected values displayed.

With a number of expected sucesses this large, we can use a normal distribution with the same mean and variance a a close approximation to the binomial distribution. Thus the z-statistic ([obs-mean]/std.dev.) should be observations from a standard normal distribution. The sum of n, squared standard normal Random Variables is distributed Chi-square with n-1 degrees of freedom. The sum of the squared z's for the 366 birthdates was 1356.5. Compare this to the 99.9%ile point of a Chi-square with 365 d.f which is 454.2. The z2 statistic is higher which causes us to reject the hypotheses of uniformity.
In less formal terms, the data show too much variation to be accounted for by random deviations from binomial (or normal) distributions with the same mean. Here is a histogram of the distribution of z statistics from the data with a standard normal distribution for comparison.

The data z's show much more dispersion than the standard normal with fewer observations near the mean and more observations further away.
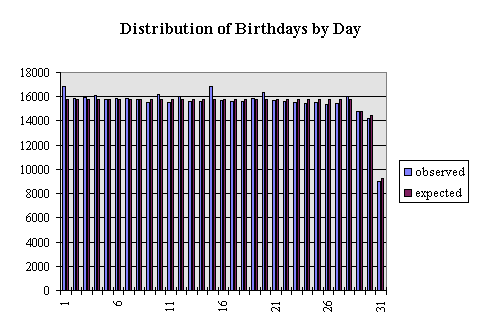
The analysis by day shows some interesting results.

The squared z's when tabulated by day of the month was 247.3 and the corrosponding 99.9%ile from a Chi-square with 30 d.f. is 59.7. Again a significant departure from expected. The histogram shows that some days are over reported. The higest positive deviations are from the 1st and 15th with the 20th and the 10th sticking out somewhat less. The data were collected by insurance agents asking the person their birthdate. The data are not otherwise checked until a claim is made and a death certificate shows a significantly different birthdate. I suspect that older persons may not know their exact date of birth. I can see no other reason for dates to fall on such regular points. It has been well documented by the U.S. Census Bureau that people overreport the year of birth 1900 and underreport 1899 and 1901. I ran a smaller run (n=116,979) with years of birth between 1960 and 1993. The z-squared statistic was still larger than the chi-square indicating a significant deviation from uniformity, but much closer (z2=74.7) for what its worth.
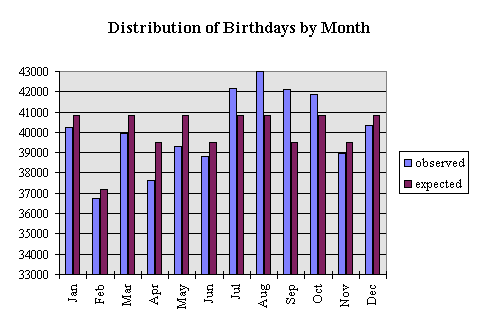
The analysis by month is also instructive.

The z-square is 612.5 and the corresponding 99.9%ile Chi-square is 31.3 for 11 degrees of freedom. Again there is more variance in the data than can be accounted for by chance. An examination of the histogram shows significant seasonal variations. The months July - October show higher than expected births and March - May show the most significant decline in births. Perhaps the most reasonable explanation is that conceptions are up in the months of October through January and down in June through August. You be the judge.
The implications for the original questions are that slightly fewer persons are needed to get a single match and slightly more persons are needed to have every day covered if the distribution is not uniform.