
MapProjector 4.0.2
©1995-2002
MapProjector 4.0.2
©1995-2002
TABLE OF CONTENTS
Introduction
Description of Menu Commands
File menu
Edit menu
Map menu
Projection menu
Annotate menu
Window menu
MacOS X menus
Notes
Contact Information
Credits
 This symbol designates items that can take advantage of features available on postscript printers.
INTRODUCTION
MapProjector 4.0.2 is a graphics program that can be used to view, alter and process images of global maps. Some of the primary functions of the program include the ability to recenter images, extract specific regions, and convert images to different projections (mollweide, orthographic, stereographic). Functions are also available to annotate images with features such as scalebars, latitude and longitude grid lines and continental overlays. Global maps are assumed to be rectilinear when they are first read in and users are asked to assign the latitude and longitude coordinates of their map when opening the image for the first time (figure 1). The map coordinates are subsequently embedded within the image file after they are saved in MapProjector’s native format.
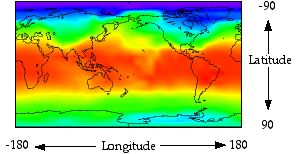
Figure 1
DESCRIPTION OF MENU COMMANDS
File menu
Open brings up the standard open dialog box. You can open PICT, JPEG, GIF, Photoshop, TIFF, and Windows Bitmap (BMP) files. If the image is not in PICT format then Quicktime will translate it automatically (assuming you have Quicktime installed).
Once a file is selected the user is asked to define the coordinates of the image for use in MapProjector (figure 2). These coordinates will be used by MapProjector to manipulate the image and they remain with the image as long as the image is saved in native MapProjector format.
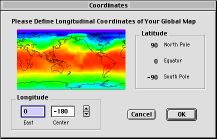
Figure 2
Open From Clipboard creates a new window from an image stored in the clipboard. If the image was copied from another program then MapProjector will ask you to define coordinates for this image as it is opened.
Close will close the current document window. If you have any unsaved changes MapProjector will ask if you want to save the changes.
Save will save the current document. If the current document has never been saved before then you will have to choose where to save the document.
Save As lets you save the current window under a different name.
Revert changes the image back to the way it was the last time you saved the image. The command can be very helpful if you just removed part of the image or did some other operation that can’t easily be undone.
Export Overlay  tries to convert an image into an overlay for use with the Add Overlay command in the Annotate menu (see section 2.6). Only an image created in certain draw programs can be exported as an overlay by MapProjector 4.0.2. Some common draw programs that have been tested include: Illustrator, AppleWorks, Freehand, SuperPaint, and Canvas. Using these programs you must save your image as in PICT format and then reopen them using MapProjector from which they can be converted to overlay files. The Export Overlay dialog sets the quality of the overlay (figure 3). Higher quality breaks down longer lines into shorter segments, thus producing more accurate images. However, higher quality overlays require more memory in a PostScript printer. If your PostScript printer cannot print an overlay you will need to export it at lower quality.
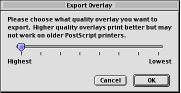
Figure 3: Export options for overlays.
When you export an image MapProjector looks for every polygon in the image. If an image does not have any polygons then MapProjector will not create an overlay. If any polygons in an image go outside the visible part of the image, then you can choose what to do with the polygon (figure 4). Force will remove the parts of the polygon that are outside the visible image. Cancel will stop the whole export to overlay. Skip will not include the polygon in the overlay. Skip is particularly helpful if some of your polygons are rectangles around the whole image, or invisible. You can see the Overlay Tutorial for an example of how to create an overlay from an image.
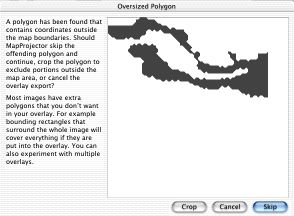
Figure 4: Oversized polygons.
Page Setup gives you the options for your current printer and allows you to rescale the printed size of your image.
Print  MapProjector uses PostScript to enhance images when they print. This means that MapProjector can take advantage of postscript’s ability to print fractional line widths, smoothed continental overlays, and many other enhancements (figure 4). Most laser printers, and a few inkjet printers, can print PostScript.
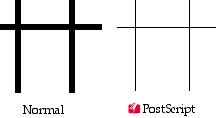
Figure 5: Grid lines printed in non-PostScript (left) versus PostScript (right).
Quit closes all the document windows in MapProjector and then quits the program. You will be asked if you want to save any changes to documents before closing them.
Edit menu
Copy places in the clipboard the part of the image you have selected. The coordinates for your selection are copied as well.
Select All selects the entire image, even if it is to big to display on the screen.
Select None lets you deselect an image.
New Window From Clipboard creates a new document window from an image in the clipboard.
New Window From Selection creates a new document window with only the part of the current image you have selected.
Preferences lets you change certain features of MapProjector. There are three areas of the Preferences dialog (figure 5): Menus, Colors, and Previews. Menus lets you show or hide the Annotate menu. If you show or hide a menu the change will take effect the next time you open MapProjector. Colors are the default colors for various annotations you can make in MapProjector. Previews affects the way that files are saved. The Icon Preview will create a custom icon that looks like a scaled down version of the image. The Image Preview will create a smaller version of the image that you can see when you use the Open dialog box in most programs.
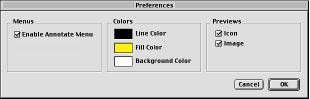
Figure 6
Map menu
New Map from Coordinates lets you create a new image from a specific area of an existing image (figure 6). A black border in the preview window indicates the subregion that will be used to create the new image. Northern and southern boundaries are specified by latitude coordinates. The western boundary is set by assigning a longitude coordinate. However, the eastern boundary is set by assigning an image width in degrees (due to issues related to recentered images).
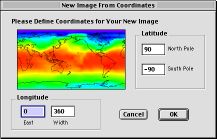
Figure 7
New Map from Selection creates a new image based on the area within you current selection. The longitude and latitude positions of your cursor selection appear in the upper left hand corner of the image.
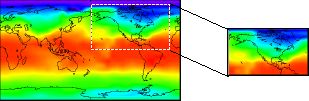
Figure 8
Recenter Image lets you change the central meridian of the image. The Recenter dialog (fig 8) gives you a preview of what the image will look like after it is recentered.
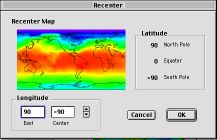
Figure 9
Define Map Coordinates allows the user to redefine the longitudinal coordinates of the global map (see figure 2).
Projection menu
Three projections can currently be created from a rectilinear image: Mollweide, Orthographic, and Stereographic (figure 9). The mollweide projection is a full-earth projection while orthographic and stereographic projections are commonly used to show hemispheric images (though they are not limited, strictly, to half-earth images).
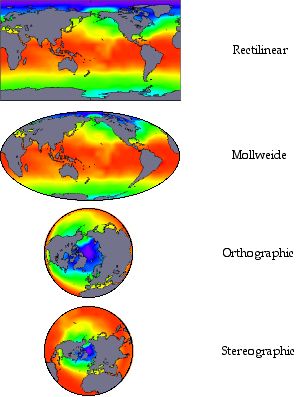
Figure 10: Projections that can be generated using MapProjector 4.0.2
Three options may be set in each of the projection dialog boxes: The background color of the image, the resolution, and the outline color. Background colors are required because projected images do not evenly fill the rectangular windows in which they appear. Outlines are used to separate the projected image from the background and can be drawn in either black or white (or removed entirely). The resolution option is used to improve the quality of a projected image in regions where the bitmap is stretched by the projection. Generally, you will need to use the Page Setup command to resize images that have been projected at high resolutions before you print them. Alternatively, you can use a graphics program such as AppleWorks® or Adobe Illustrator® to rescale high resolution images.
Orthographic and stereographic projections have additional options that can be set including the latitudinal and longitudinal centers of the images and the radius, in degrees, of the area to be projected.
Annotate menu
Add Scale Bars allows you to add a latitude and longitude scale around the border of the image. The menu item will change to Remove Scale Bars if a scale bar has previously been placed on the image.
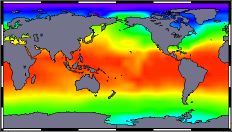
Figure 11: An image with scale bars.
Add Grid Lines  places a grid over the image (figure 11). The dialog box makes available a variety of preset grids that represent common resolutions of the global climate models used at NASA-GISS. However, you can define your own grids through the latitude and longitude fields in the dialog box. The polar grid cell is set separately since most GCMs use a non-tetrahedral cell that is centered over the poles and which may be of different latitudinal width than other grid cells. The longitude offset lets you shift the grid east or west. The line width can be fractional, however, a PostScript printer is required to print fractional width lines and to place grid lines at their exact location on the image. The menu item will change to Remove Grid if a grid has previously been placed on the image.
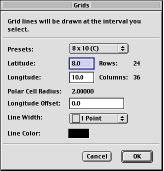
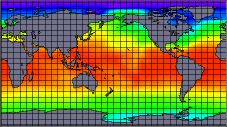
Figure 12: The dialog box for adding grids to an image and the resulting image.
Trim/Expand Image removes or adds a specific number of pixels from all sides of the image. The dialog (figure 12) gives a preview of what the image will look like after it is padded or trimmed. The coordinates of the image are not affected by Trim/Expand Image, so you can trim off unwanted edges (e.g. that may have inadvertently been added by a graphics program) and still have a global image.
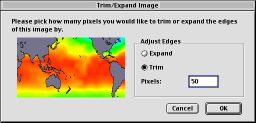
Figure 13
Add Overlay  allows you to mask an image with a continental overlay or other information (data points, unique annotations, etc.). Overlays consist of polygons and cover part of your image. The polygons can either be displayed as hollow outlines or they can be filled. Overlays are useful to relate data to geographic locations and to hide irrelevant regions in an image (e.g. continent masks are used for images that show ocean data only). On PostScript printers the overlay will be smoothed.
The Overlay dialog (figure 13) allows you to change the line width and color of the outline. If you don’t want an outline then pick a line width of 0. Remember that fractional width lines will only print correctly on PostScript printers. The fill color of polygons may be set separately. The menu item will change to Remove Overlay if an overlay has previously been placed on the image.
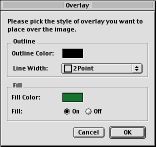
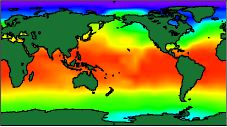
Figure 14: The Add Overlay dialog box and resulting image
(with a particularly gaudy overlay).
Window menu
Zoom contains a sub menu that allows magnification of the image.
Zoom In doubles the magnification of the image. Clicking on the image while holding down the option key is the same as using the zoom in menu item.
Zoom Out halves the magnification of the image. Clicking on the image while holding down the option and shift keys is the same as using the zoom out menu item.
Preset magnification options include 12%, 25%, 50%, 100%, 200%, 400%, 800%. A check mark will appear by the item that matches the images current magnification.
Other magnifications can also be selected to set arbitrary magnification levels between 12% and 8000%.
<document window name> The rest of the view menu shows a list of all open document windows. Selecting the document window’s name will bring that document window to the front.
MacOS X menus
The following items appear under the MapProjector menu in MacOS X:
Preferences lets you set certain settings for MapProjector that affect the whole program.
Hide MapProjector will hide all the document windows in MapProjector. You can click on the MapProjector icon in the Dock to reshow all the document windows.
Hide Others will hide all the other applications windows while you work in MapProjector.
Show All will show every window from every application in front of the windows for MapProjector.
Quit will close all the document windows in MapProjector and then close the program. You will be asked to save any changes to documents before you close them.
The following additional items appear under the Window menu in MacOS X:
Minimize Window places a window in the dock as if you clicked the yellow minimize button in the window’s title bar.
Bring All To Front pulls all the MapProjector windows from behind other application’s windows.
NOTES
MapProjector 4.0.2 is the first fully working Carbon version of MapProjector. A few things work a little differently in my software under MacOS X, but everything works. I highly recommend that you use MacOS X 10.1.2 because it allows MapProject to print correctly and the clipboard (copy and paste) works more smoothly with Classic applications. I did sneak a few extra features into the MacOS X version:
128x128 icons for both the program and preview icons
Dock support from the Window menu
Aqua layouts in all the dialogs so that you can read everything
The overlay format is done in ascii text so that you can manually edit or create the files if you want. You start a polygon with, “0. *” and end the file with an extra return. Each point in the polygon is a longitude and a latitude with two spaces between them. For example, “-180.00 90.00” is a point at the top left corner of the map. The only other rule is that the first and last point in each polygon should be the same, otherwise the polygon may not be closed properly. Feel free to experiment with included overlays to see how they work.
MapProjector v. 4.0.2
©1995-2002
Contact Information
For technical assistance please contact Michael Shopsin at mfs99 at columbia.edu
and for information related to the use of MapProjector with the GISS GCM contact Mark Chandler at mac59 at columbia.edu
Credits
Michael Shopsin, Supervising Programmer
Mark Chandler, Design and Editing
Tri Datta, Programmer, projection algorithms
It’s been almost three years to the day since I got CarbonLib 1.0d6 and began to carbonize MapProjector. However I couldn’t have finished the Carbon version without CodeWarrior Pro 7 and the “Nirvana” Pascal update from Metrowerks. A couple of Apple engineers on the Carbon Developer mailing list went out of their way to help me: Quinn “The Eskimo!”, Eric Schlegel, and Chris Linn.