Lab 11: TINs and 3-D Viewing
The advantage of a Triangulated Irregular Network is that it can represent a
surface with varying levels of resolution, placing many points where more detail
is needed and few points where it is not. However, it takes more computation to
work with a TIN than a raster. In ArcGIS, TINs require the 3D Analyst
extension.
1. Getting to know ArcScene
a. Defining height of a layer
While ArcMap produces only 2D maps, ArcScene presents a 3D
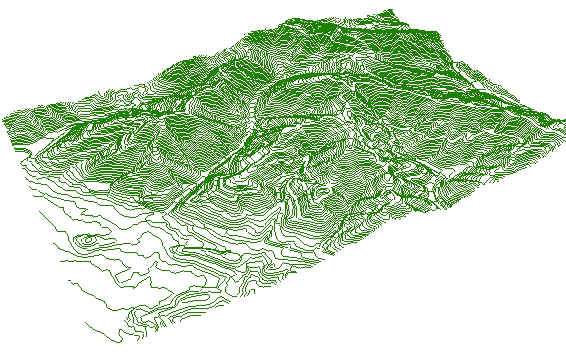
display. First, the height of the terrain must be defined, starting with the hypsography
layer, which has contour lines from the USGS topographic maps. (Caution: layers
provided with this lab are in the NAD1983 datum; layers from Lab 9
or before were in the NAD1927 datum.) The horizontal
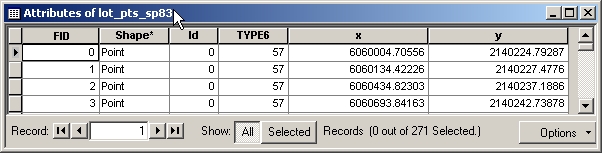
coordinates are in feet, but the SPOT field is in meters (see Lab 10).
However, according to the Attribute
Coding Standards for Digital Line Graphs, the MINOR2 field contains
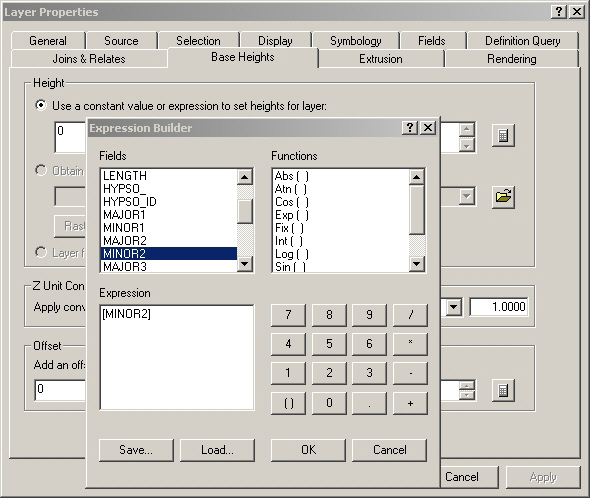
elevation in feet, so there is no need to recalculate it. Instead of using a Z
Unit Conversion as in the lab instructions, I'll just define the
height of the layer using MINOR2 directly.
These are just lines, not a surface, so lighting and hillshading don't
apply, but already they have a convincing 3D appearance to the eye. Inevitably
though, the display is usually slower to pan and zoom than the 2D
display in ArcMap, because of the computation required (especially when TINs are
displayed).
b. Creating a TIN
A TIN can be created from the contours: the vertices of the
contour lines will be the nodes of the TIN. Again, MINOR2 is the height source.
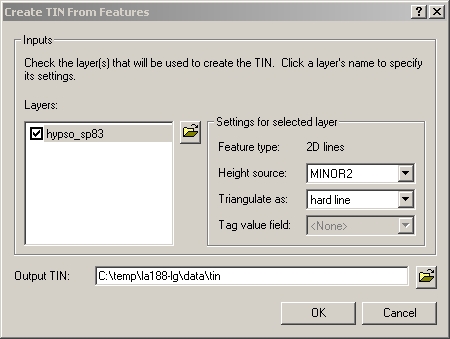
The TIN is a large and complex data structure:; its folder takes about 2.4 MB of
disk space, compared to 0.4 MB for the contour shapefile. Below, a small area of nodes and edges is
shown.
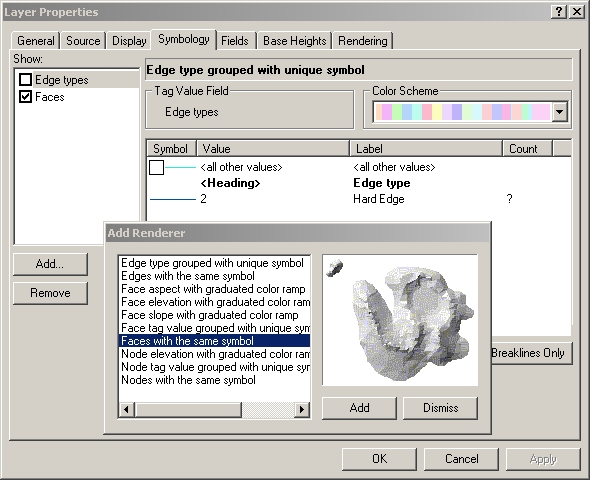
The "hard edges" (blue) are the original contour lines.
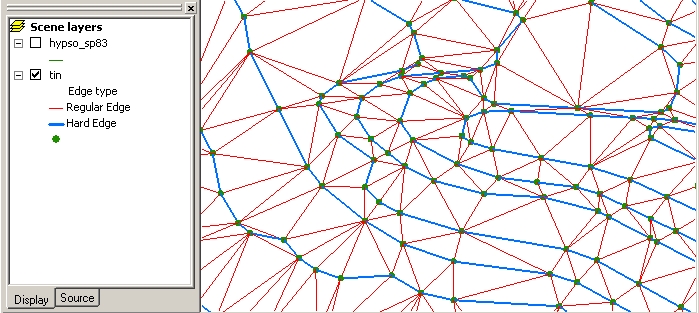
TINs often contain flat triangles, where there is a sharp bend in a contour line so that
several vertices at the same elevation are each other's
closest neighbors. This is a potential problem for hydrologic analysis, and
there are algorithms
for eliminating the flat triangles. Some flat triangles in the TIN are shown in
white below.
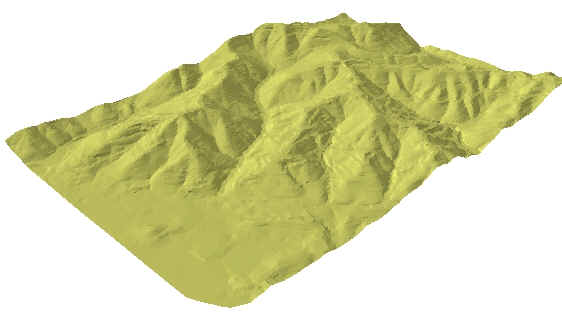
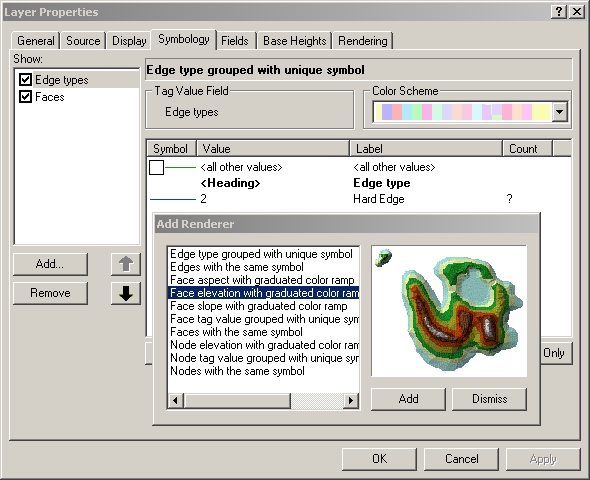
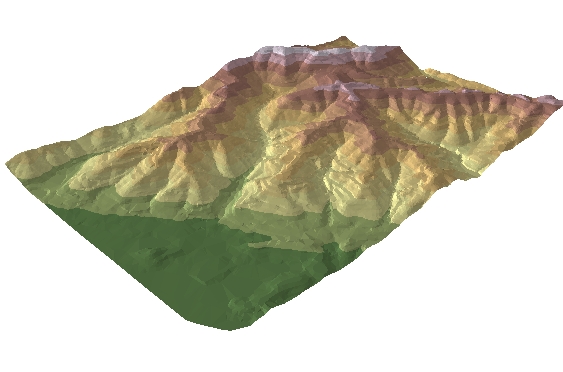
The faces can be colored various ways, for example with a single color:
Light and shadows are shown, with a default
position of the sun. I chose a light color so there would be contrast between
lighted and shaded areas.
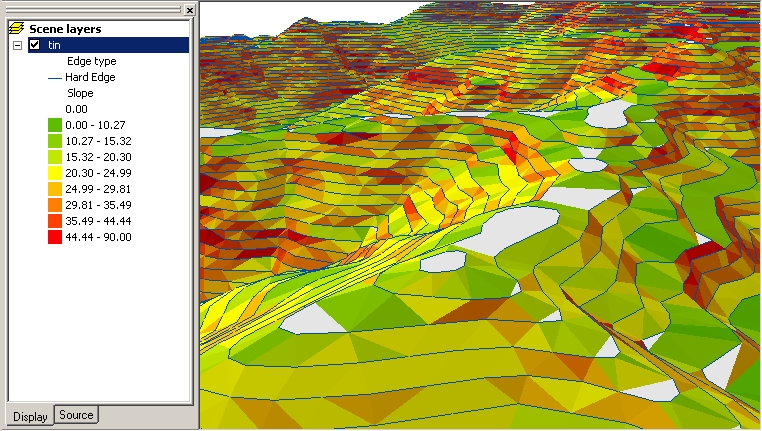
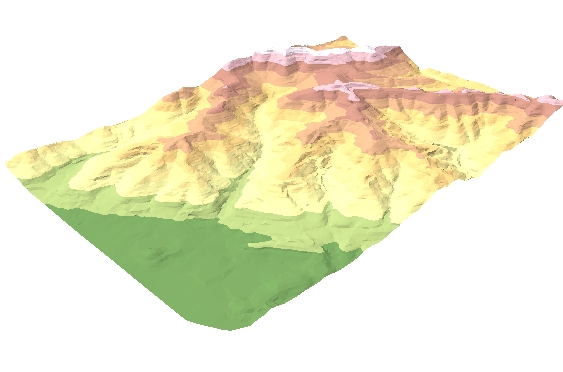
A color ramp can also be used. Note that since this TIN does not have an
attribute table, only height-related properties can be symbolized: elevation,
slope, aspect.
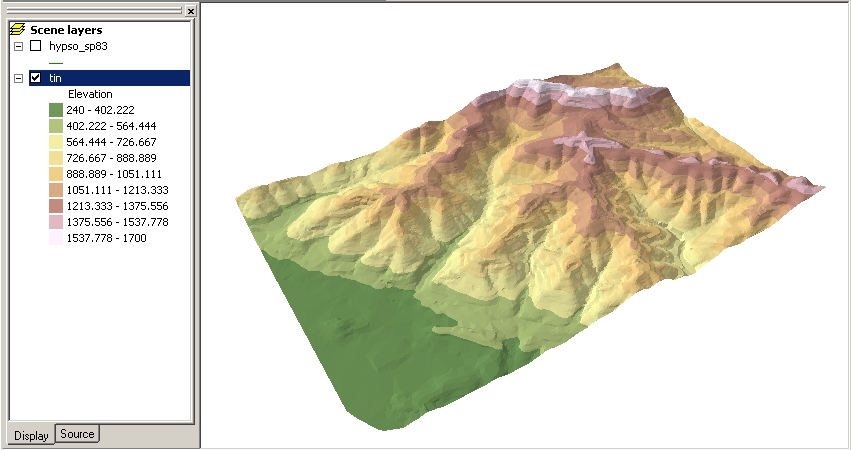
Strangely, it seems to display elevation upside down by default, with the
highest values listed first. In the scene below, I reversed the order so that
lower heights are listed first, and applied the color ramp named
"Surface", which has the conventional so-called "hypsometric
tints" running from green at the lowest elevations through yellow to red,
then white at the highest. Edges are not shown because there are so many of them that
they obscure the faces.
c. Controlling light and shadow
The position of the light source can be controlled, but I
thought that the default altitude of 30 degrees was generally the best.
Altitude = 15 degrees. Low altitudes make most of the scene too
dim. |
Altitude = 50 degrees. High altitudes make it too bright and wash out
details. |
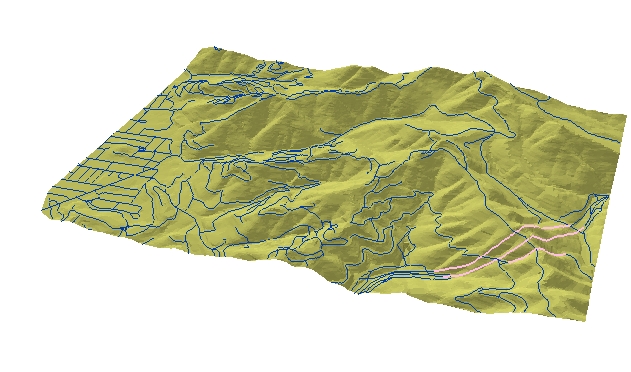
d. Draping vector layers on a surface, and converting to 3D
I added the roads layer provided with this lab, and set its base heights to be
the heights of the TIN surface. The original shapefile is unchanged; only the display is
affected. (ArcScene doesn't know that Highway 24 is in a tunnel, so it draws it
going over the surface of the hills.)
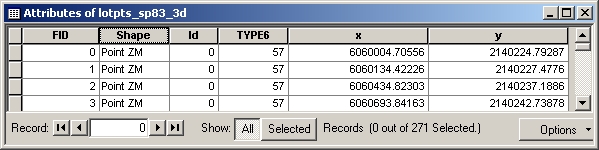
It's also possible to write a new shapefile where the points have 3
coordinates, not 2, using Convert > Features to 3D on the 3D Analyst menu.
Here the 3rd dimension is taken from the TIN again.
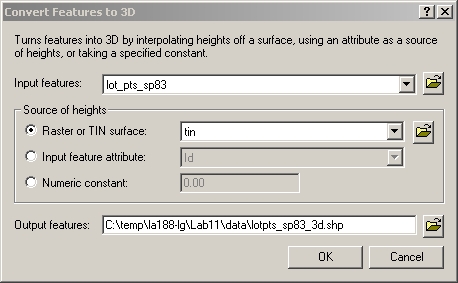
The new feature layer has the same attribute table as the original; the only
difference is that the objects in the shapefile are 3-dimensional points.
2. Suitability Analysis
All the same surface operations can be done with a TIN as with a raster:
slope, aspect, hillshade, viewshed, contours, as well as others that we haven't
looked at such as cut-and-fill volume, drainage basins, etc. I'll use the
Spatial Analyst and 3D Analyst toolbars to do a suitability study for My
New House Site in Claremont Canyon.
3. Other Applications of 3D Analysis
The 3D Analyst extension has other fun tools not used in this lab, such as
- finding steepest path
- creating contours from surface
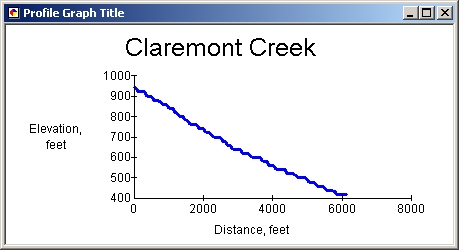
- Profile graph: height of a line feature vs. distance. For example, here's
the elevation of the main segment of Claremont Creek as it flows from the
top of the canyon to the bottom.