

Interpreting Webalizer Reports
The first page
On this page, you'll see a graph such as this:
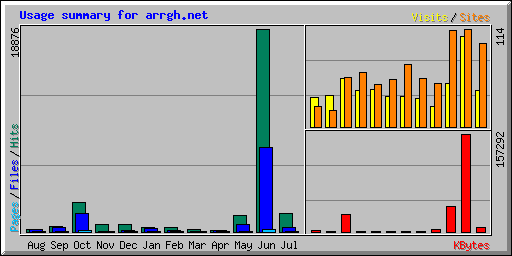
This is a summary view of the past 12 months, for comparison purposes. You'll be able to see long term trends in your web traffic at a quick glance.
The next (and last) thing of interest on the first page of your webalizer report is a table which summarizes each month for which you have run a webalizer report, and which gives both daily averages and monthly totals for Hits, Files, Pages and Visits, as well as the monthly total in Kilobytes*.
| Summary by Month | ||||||||||
|---|---|---|---|---|---|---|---|---|---|---|
| Month | Daily Avg | Monthly Totals | ||||||||
| Hits | Files | Pages | Visits | Sites | KBytes | Visits | Pages | Files | Hits | |
| Jul 2004 | 55 | 13 | 2 | 1 | 97 | 7627 | 42 | 64 | 423 | 1718 |
| Jun 2004 | 629 | 263 | 9 | 3 | 114 | 157292 | 105 | 274 | 7896 | 18876 |
| May 2004 | 49 | 22 | 2 | 1 | 112 | 40322 | 51 | 76 | 665 | 1498 |
| Apr 2004 | 5 | 3 | 1 | 0 | 51 | 4714 | 24 | 34 | 118 | 160 |
| Mar 2004 | 6 | 2 | 1 | 1 | 56 | 98 | 33 | 37 | 78 | 210 |
| Feb 2004 | 13 | 4 | 1 | 1 | 73 | 1434 | 35 | 40 | 126 | 384 |
| Jan 2004 | 12 | 9 | 1 | 1 | 55 | 466 | 35 | 49 | 294 | 380 |
| Dec 2003 | 24 | 4 | 2 | 1 | 50 | 1192 | 44 | 62 | 148 | 732 |
| Nov 2003 | 24 | 3 | 1 | 1 | 63 | 284 | 42 | 50 | 92 | 728 |
| Oct 2003 | 89 | 55 | 3 | 1 | 58 | 28154 | 56 | 112 | 1708 | 2788 |
| Sep 2003 | 17 | 14 | 1 | 1 | 19 | 450 | 37 | 47 | 422 | 516 |
| Aug 2003 | 8 | 6 | 1 | 1 | 24 | 2797 | 34 | 42 | 208 | 272 |
| Totals | 244830 | 538 | 887 | 12178 | 28262 | |||||
Each month in the left hand column is a link to a more detailed breakdown of that month's traffic.
The Details
The data being presented to you takes the form of Hits, Files, Visits,
Sites, Pages, Kilobytes, URLs, Referrers, User Agents and Response codes.
All of these data are generated by interpreting a series of web transfers
as logged by our Apache web servers. Apache creates a line such as this:
66.196.90.216 - - [12/Aug/2004:04:02:03 -0400] "GET http://www.arrgh.net/music/data.php?composer_name=Gorecki HTTP/1.0" 200 659 "-" "Mozilla/5.0 (compatible; Yahoo! Slurp; http://help.yahoo.com/help/us/ysearch/slurp)"
Each such line breaks down to the following data:
- Internet address of the machine visiting your site
- The date, time, and time zone as an offset from GMT
- The specific request. In most cases, this will be GET, but there may also be POST and HEAD requests.
- The URL being requested
- The HTTP protocol used for the request
- The response code
- The number of bytes transferred
- The referring page
- The user agent
From this data, webalizer crafts various views of your web traffic.
Definitions
- Hits measure the total number of requests made to the server
during the given time period (month, day, hour etc..). Each separate
item on a single page will produce a hit when the page is requested.
For example, if you have a page with 3 graphics and some text, a request
for that page will (usually) result in 4 hits.
- Files measure the total number of hits (requests) that actually
resulted in something being sent back to the user. Not all hits will
send data, such as 404-Not Found requests and requests for pages that
are already in the browsers cache.
- A Site is a unique IP address (or hostname, if you are doing
name resolution) that made requests to the server. This is less useful
than it may appear, because many different computers can share a
single address, and the same visitor can also visit from many addresses,
so it should be used simply as a rough gauge as to the number of visitors
to your server.
- Pages are those URLs that would be considered the actual page
being requested, and not all of the individual items that make it up
(such as images and audio clips). Webalizer's default is to consider
any URL that has an extension of .htm, .html or .cgi as a Page. If
you use php at panix, you might wish to add lines to your
webalizer.conf file to add .php to this list:
PageType .htm*
PageType .cgi
PageType .php
- A Visit is recorded when some remote site makes a request for a
page on your server for the first time. As long as the same site keeps
making requests within a given timeout period, they will all be
considered part of the same visit. If the site makes a request to your
server, and the length of time since the last request is greater than
the specified timeout (default is 30 minutes), a new visit is counted.
Since only pages will trigger a visit, remote sites that link
to graphic and other non-page URLs will not be counted in the visit
totals.
- A KByte* (KB) is 1024 bytes (1 Kilobyte). Used to show the amount
of data that was transfered between the server and remote machines,
based on the data found in the server log. Note that at Panix, the
logs you should be using for webalizer do not accurately reflect the
total number of Kilobytes sent, so webalizer's Kilobyte count should
not be used for accounting purposes, such as double checking transfers
on your bill. See below for more information on this.
- URL - Uniform Resource Locator. All requests made to a web
server need to request something. A URL is that something, and represents
an object somewhere on your server, that is accessible to the remote user,
or results in an error (ie: 404 - Not found). URLs can be of any file type.
- Referrers are those URLs that lead a user to your site or caused
the browser to request something from your server. The vast majority of
requests are made from your own URLs, since most HTML pages contain links
to other objects such as graphics files. If one of your HTML pages contains
links to 5 images, then each request for the HTML page will produce
5 more hits with your page as referrer.
- Search Strings are obtained by examining the referrer string
and looking for known patterns from various search engines. The search
engines and the patterns to look for can be specified by the user within
a configuration file. The default will catch most of the major ones.
- User Agents Are software programs which connect to the web server
and make requests. Most User Agents are browsers, such as IE, Mozilla
or Netscape. Each user agent reports itself in a unique way to your
server. Keep in mind however, that many browsers allow the user to change
it's reported name, so you might see some obvious fake names in the
listing.
- Entry and Exit pages are those pages that were the first
requested in a visit (Entry), and the last requested (Exit). These pages
are calculated using the visits logic above. When a visit is first
triggered, the requested page is counted as an Entry page, and whatever
the last requested URL was, is counted as an Exit page.
- Countries are determined based on the top level domain of the
requesting site. This is questionable however, as there is no longer
strong enforcement of domains as there was in the past. A .COM domain
may reside in the US, or somewhere else. An .IL domain may actually be
in Israel, however it may also be located in the US or elsewhere.
A large percentage may also be shown as Unresolved/Unknown because a
fairly large percentage of dialup and other customer access points do
not resolve IP addresses to a name, and so are left as an IP address.
If you are not doing name resolution in your reports, all hits will be
recorded as Unresolved/Unknown here.
- Response Codes are defined as part of the HTTP/1.1 protocol (RFC 2068; See Chapter 10). These codes are generated by the web server and indicate the completion status of each request made to it.
* You cannot use the Kbytes as reported by webalizer to check your billed transfers. Panix uses web accelerators known as Squids. The squids cache pages and, if the actual page has not changed, serves the page from it's cache rather than the web server. In the process of doing this, duplicate log entries are created for a File; one for the squids and one for the web server. The web server log entry will not show any bytes transferred, however, so you need to get squid logs as well as web logs to check on bytes transferred. This can be done using the '-a' switch to getlogs. We do not do this by default for webalizer processing because the duplicate log entries would render the rest of Webalizer's statistics grossly inaccurate.